Data Visualization Analyst
OpenAI
Job Overview
Who's the hiring manager?
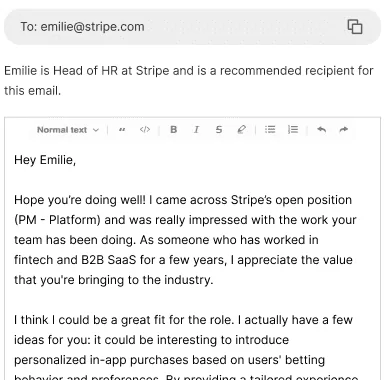
Sign up to PitchMeAI to discover the hiring manager's details for this job. We will also write them an intro email for you.
Job Description
About The Team
The Intelligence and Investigations team at OpenAI is dedicated to rapidly identifying and mitigating abuse and strategic risks to ensure a safe online ecosystem. We focus on uncovering emerging abuse trends, analyzing potential risks, and collaborating with internal and external partners to implement effective mitigation strategies. This work is crucial to OpenAI's mission of developing AI that benefits humanity.
The Strategic Intelligence & Analysis (SIA) team specifically provides safety intelligence for OpenAI’s products by monitoring, analyzing, and forecasting real-world abuse, geopolitical risks, and strategic threats. Our insights guide safety mitigations, product decisions, and partnerships, ensuring the secure and responsible deployment of OpenAI’s tools across critical sectors.
About The Role
We are seeking a Data Visualization Analyst to transform complex intelligence and forecast outputs into clear, interactive visual narratives that will shape OpenAI's risk management strategies. In this pivotal role, you will be responsible for building the dashboards, maps, and visual frameworks that leadership and partners depend on to understand emerging risks, their evolution over time, and the efficacy of various mitigations.
You will leverage your expertise in data visualization, forecasting literacy, and strong visual design skills to create intuitive "front doors" into our risk landscape. These will include interactive views of safety and abuse patterns, geopolitical developments, and market shifts across different regions and supply chains. This role involves close collaboration with analysts, forecasters, investigators, data scientists, and policy partners to distill diverse, multi-source inputs into visual products that directly influence company priorities and resource allocation.
In this role, you will:
- Design And Build Dashboards And Interactive Visualizations That Track:
- Emerging safety and abuse risks across products and geographies.
- Geopolitical developments that affect OpenAI’s risk posture.
- Key abuse cases and incident trends using both structured and unstructured data.
- Develop Interactive Risk Views Such As:
- Prioritization heat maps for safety and abuse scenarios.
- “Emerging risks” boards with drill-downs for deep dives.
- Forecast views of risk trajectories, including scenario comparisons over time.
- Partner With Analysts And Investigators To:
- Translate narrative intelligence, case studies, and OSINT into visual formats.
- Standardize how we visualize incidents, metrics, campaigns, and risk clusters.
- Iterate quickly on visual prototypes in response to ongoing investigations or emerging crises.
- Collaborate with data science, Safety Systems, Integrity, Global Affairs, and Product teams to:
- Ingest and align data from multiple internal systems and external sources.
- Ensure visualizations are accurate, timely, and consistent with existing metrics and taxonomies.
- Build views that are directly usable in leadership reviews, safety councils, and partner briefings.
- Establish And Maintain a Visual “Source Of Truth” For:
- Top strategic risk themes and their evolution over time.
- Cross-geography views (e.g., markets, supply chains, infrastructure) for safety and geopolitical risk.
- Key mitigations and owners linked to specific risk categories or regions.
- Create templates, style guides, and reusable components so that the team can rapidly produce consistent, high-quality visual materials (dashboards, one-pagers, workshop materials, and exec reviews).
You might thrive in this role if you have:
- Significant experience (typically 4+ years) in data visualization, business intelligence, or analytics, ideally in security, trust and safety, intelligence, risk, or policy environments.
- Demonstrated expertise with at least one major data visualization / BI stack (e.g., Tableau, Looker, Power BI, Mode, Superset, or equivalent), including building interactive dashboards for non-technical stakeholders.
- Strong baseline analytics skills, including experience taking data from APIs, building ETL pipelines, and wrangling structured and unstructured data into real-time or near-real-time dashboards; familiarity with real-time or streaming data frameworks is a plus.
- Familiarity with React or D3.js (or similar JavaScript-based visualization libraries), with the ability to build or customize visual components directly in code, is a strong plus for this role.
- Experience visualizing time-series, event-based, and scenario/forecast data, including trendlines, trajectories, leading indicators, and clear communication of uncertainty and confidence levels.
- Strong skills in structuring and visualizing complex problem spaces, such as multi-dimensional risk taxonomies, prioritization frameworks (likelihood, impact, exposure), and geospatial/network views.
- Solid visual and graphic design capabilities, including an eye for clear information design, layout, visual hierarchy, and the ability to apply consistent visual standards across dashboards and static materials. Experience with design tools such as Figma, Adobe Illustrator, or a strong portfolio.
- Ability to work with data from diverse sources and levels of maturity (structured metrics, case notes, OSINT, qualitative assessments) and to design visuals that faithfully reflect both the data and its limits.
- Proficiency in SQL and working knowledge of Python for querying large datasets, exploratory analysis, and building data pipelines that feed dashboards and reporting.
- Proven experience collaborating with cross-functional partners (e.g., analysts, data scientists, policy teams, operations) to define requirements and iterate quickly on visual products.
- Strong written and verbal communication skills, including the ability to walk stakeholders through visualizations, design choices, and forecast representations in a clear and concise way.
Key skills/competency
- Data Visualization
- Business Intelligence
- Tableau
- Looker
- Power BI
- SQL
- Python
- ETL Pipelines
- Risk Analysis
- Information Design
How to Get Hired at OpenAI
- Research OpenAI's mission: Study their dedication to beneficial AI, safety, and ethical deployment.
- Tailor your resume: Highlight data visualization, BI tools, SQL, Python, and risk analysis experience for OpenAI's needs.
- Showcase your portfolio: Demonstrate interactive dashboards and visual design skills with clear case studies.
- Prepare for technical interviews: Practice SQL queries, data wrangling, and discuss data visualization best practices for OpenAI.
- Understand OpenAI's culture: Emphasize collaboration, innovation, and a commitment to safety and responsible AI development.
Frequently Asked Questions
Find answers to common questions about this job opportunity
Explore similar opportunities that match your background